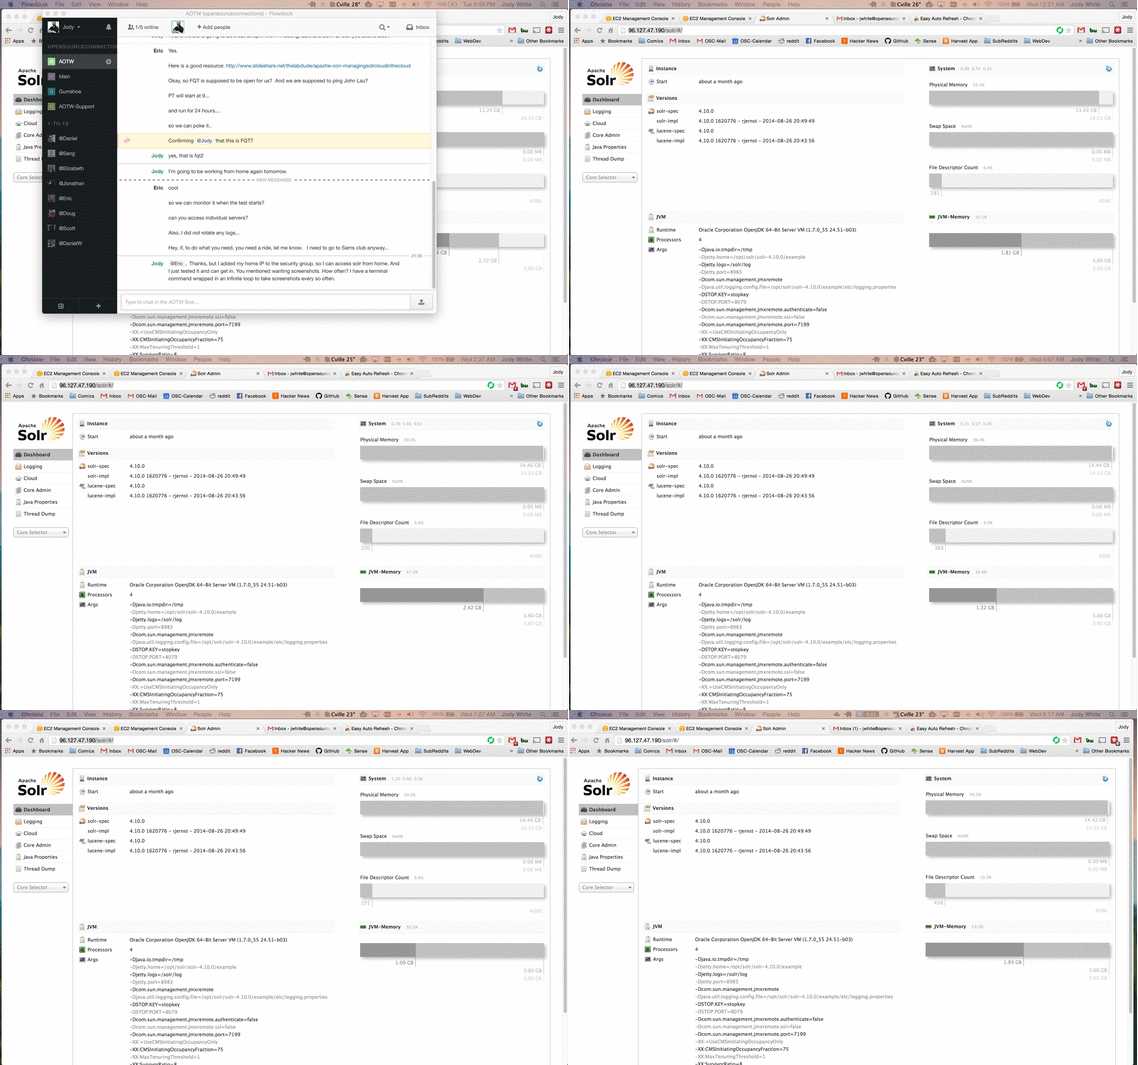
What is the solution when you’re doing a 24 hour load test, you haven’t already set up monitoring and you need to easily see the Physical Memory and JVM Memory Utilization?
Hack it together!
We were recently in the position where a Performance Load test was going to start at 10pm one night and end at 10pm the next night. We wanted to see the effect of a long running load test on the stability of the server, but who wants to stay up late hitting refresh?
Add a dash of creativity to a terminal command wrapped in an infinite loop and a Chrome plugin and you have a quick, easy, and cheap Solr monitoring solution!
##The pluginA quick Google search pointed me to the plugin Easy Auto Refresh. You simply click the extension icon in the Omnibox, enter in the number of seconds you want between refreshes and hit start. It will go on until you click stop.
##The terminal commandI was doing this on a Mac and surprisingly I didn’t see a quick and easy way of doing this with Automator. But another quick Google search led to this terminal hack.
while [ 1 ];do vardate=$(date +%d\-%m\-%Y_%H.%M.%S); screencapture -t jpg -x /path/to/save/$vardate.jpg; sleep 600; doneThis sets up an inifinite loop, store the filename consisting of the date and current time of the screenshot in a variable, calls the command, sets the filetype, then the path, and then how often to take the screenshot in seconds.
##Putting it all together.I decided to grab a screenshot every ten minutes. I set the plugin to reload every 594 seconds (I had to choose a few seconds before the screenshot went off to make sure I didn’t grab a screenshot of a page refresh. Then run the terminal command to grab a screenshot every 600 seconds (10 minutes).
I started a few minutes before the performance test started and left it going over night.
When I checked around 9am we had a great “flipbook” of screenshots of the Solr admin panel showing memory utilization. Having the date show up in the toolbar provides timing context to each image for later correlation with other monitoring tools.
##Wrapping it upAfter getting the screenshots you can use one of several tools to make a movie or what I did was just made an animated .gif.

We can see several things.
1) The memory immediately starts gradually increasing and maxes out around 2am. We found out from the Performance Analysis Results that Solr didn’t start throwing errors 500/502/504 until around 4am.
2) We can see the JVM garbage collection going off and unfortunately see some large spikes within those 10 minute intervals.
3) We can see the temperature gradually drop in Charlottesville through the course of the evening and we see that my Crashplan did in fact go off around 3:17am and my data is safe! 🙂
##SummaryThere are some good monitoring solutions out there but if something hasn’t been setup already and you’re in a hurry to do some testing, this is a fun little hack to get some Solr monitoring!