Category: Uncategorized
Do you have location data in your Solr index? Are you making use of it? A typical thing that comes to mindwhen thinking about search results is a list of records with various fields that you paginate through. If youhave location data, why not plot those results on a map for a more interesting visualization of your search results?
OpenLayers
For this example we’re using OpenLayers for the map visualization. If you have lat/lon datain your Solr index, there isn’t much overhead to getting a visualization up and running. For simplicity’s sake, we’llalso be using the angular-openlayers-directive. If you’re not usingAngular, not to worry, you just might need to get your hands a little bit more dirty interfacing directly with the OpenLayers API.
Pointing Things Out
In the interest of brevity, this article makes the assumption you’re already querying Solr and have data available to use (If that’s not the case,check out the source code linked below for a full fledged example!) Let’s get started with what the view code looks like using the angular-openlayers-directive.
So not too shabby. We open with the openlayers tag to create a map using the default OpenStreetMap tile set. Within that, we’re usingng-repeat to display all of the marker data we have. ol-marker-properties tells the marker directive to look in the marker object for data.
What properties does the marker object need?
lat: Latitudelon: Longitude(optional) label: { message: "Your message for the marker", show: true/false showOnMouseOver: true/false showOnMouseClick: true/false}At this point, if you’ve setup a list of markers, you’ll have your data being rendered on the map.
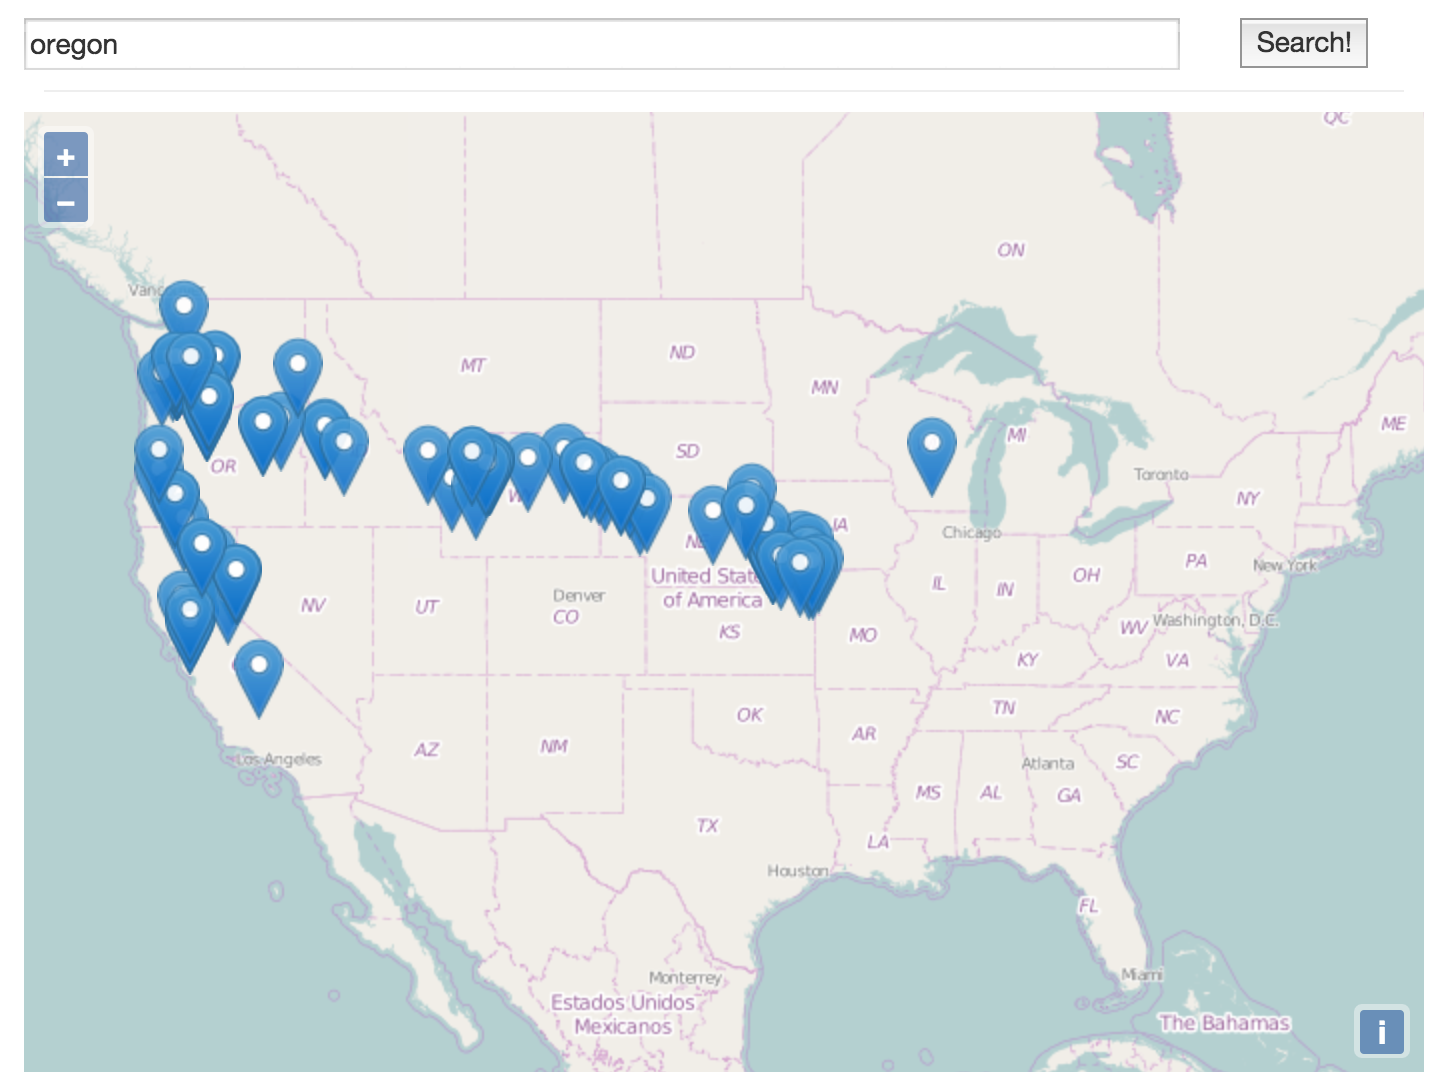
A visualization of Historical markers related to Oregon. (Vaguely outling the Oregon Trail)
Heating Things Up
OpenLayers also provides support for heatmap visualizations. Unfortunately we can’t get away with the simple data structure we used for the markers.To get heatmaps up and running, we need to pass in location data that OpenLayers can make sense of. For this example we’re using GeoJSON.
Below is a simple JS function demonstrating how to build out a GeoJSON object given a list of coordinate data:
function toGeoJson(data) { var geojson = { type: 'FeatureCollection', features: [] }; angular.forEach(data, function(value, key) { var coordData = value.coords.split(','); for(var i = 0; i < coordData.length; i++) { coordData[i] = parseFloat(coordData[i]); } coordData.reverse(); var marker = { type: 'Feature', geometry: { type: 'Point', coordinates: coordData }, properties: { name: value.name, description: value.description } }; geojson.features.push(marker); }); return geojson; };Heatmaps require their own layer. In your controller logic prepare the layer as detailed below:
$scope.layer = { opacity: 0.5, type: 'Heatmap', source: { type: 'GeoJSON', radius: 5, geojson: { object: yourGeoJsonData } } };Once your layer is prepared, you can display it using the following view code:
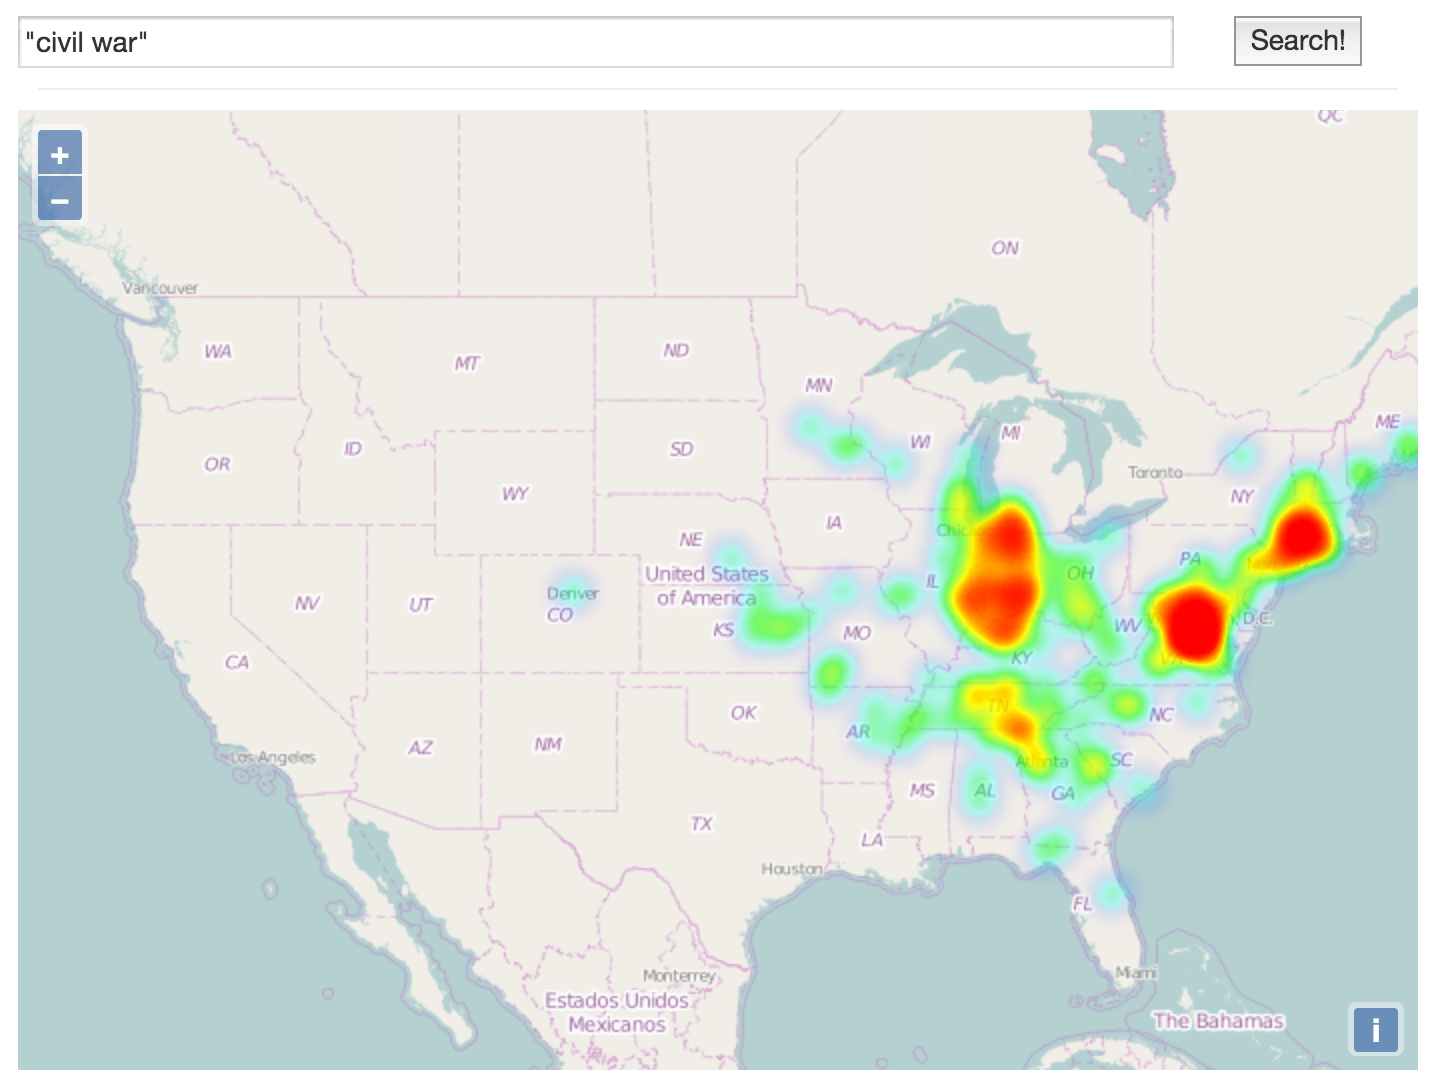
A heatmap demonstrating the clustering of Civil War historical markers in the US
A Live Example
This was a quick overview of getting your location data rendered in OpenLayers. If you want to see this code in action, check out HMDB Markers.This project utilizes data from the Historical Marker database to demonstrate pairing search with marker and heatmap views. The full source is available on GitHub at solr-spatial-viz
Thanks for reading!