

Improving search requires experimentation. Experimentation requires changing things and changing things carries risk.
While updating your search algorithm has the potential to bring better results, it can also change things for the worse. By quantifying the churn in search results, we can compare risk profiles of different experiments.
This post describes using the Jaccard index to quantify the churn in results between a control (production) and test (experimental) algorithm. This gives each experiment a risk profile to help assess which experiments graduate from the offline search lab and make their way into online testing. Using the Jaccard index is an appealing way to capture this information because it requires zero relevance judgments be collected.
Jaccard Index
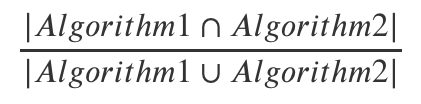
The Jaccard index, also called the Jaccard similarity coefficient, measures the amount of overlap between two sets. In our search context, these two sets are the results returned by two ranking algorithms. This is the mathematical definition:
Let’s walk through a visual calculation for an example page of results.
This table shows the two sets of search results. Here the search results only contain five documents. Your results will probably have more than 5 documents, but the same concept applies.
| Algorithm 1 | Algorithm 2 |
| DocID: 1 | DocID: 5 |
| DocID: 2 | DocID: 1 |
| DocID: 5 | DocID: 9 |
| DocID: 9 | DocID: 12 |
| DocID: 12 | DocID: 14 |
If we highlight the documents returned by both algorithms, we can see that four documents (DocIDs 1, 5, 9, 12) overlap or are shared between the result sets. That leaves two documents (DocIDs 2, 14) that are unique to one of the result sets.
| Algorithm 1 | Algorithm 2 |
| DocID: 1 | DocID: 5 |
| DocID: 2 | DocID: 1 |
| DocID: 5 | DocID: 9 |
| DocID: 9 | DocID: 12 |
| DocID: 12 | DocID: 14 |
In total six* different documents are returned. This means our Jaccard index is 4 / 6 ~ 0.66. A Jaccard index is always between 0 (no overlap) and 1 (identical). * =? Atita Arora
If we have a second algorithm to test:
| Algorithm 1 | Algorithm 2 |
| DocID: 1 | DocID: 12 |
| DocID: 2 | DocID: 9 |
| DocID: 5 | DocID: 10 |
| DocID: 9 | DocID: 11 |
| DocID: 12 | DocID: 16 |
We end up with a Jaccard index of 2 / 8 ~ 0.25. That means this second experiment changes the results more than the first, so it carries more risk.
Notes:
- I find it most useful to calculate the result set based on the first page of results and not all of the documents returned by a query. Doing this keeps us focused on the location that matters most. Depending on your search UI you might want to restrict this even further to “above the fold” or the results visible without scrolling.
- If you have a small number of results in one or both of the algorithms being compared, be very cautious with your interpretation. Always check the number of results you get from both algorithms. <- ? Rene Kriegler
- Jaccard index does not care about position. I think that is OK for what we need to know here, but its a blind spot. Consider using another metric to asses which ordering is optimal.
Extending the Jaccard index to many queries
The examples above are only for a single query. In reality we’d want to test this across many queries. Testing across many queries will give us an idea of how the typical query is impacted by a search algorithm change.
I think it makes a lot of sense to conduct this analysis on your top N queries, because that’s where most of your traffic is. An N of 500 should be plenty to gauge what the average churn will be. If you are testing a new algorithm that is designed to improve performance on the long tail you might want to do a uniform sampling of N queries instead of using the most frequent.
Visualizing it for the full picture
Plotting is almost always my preference for reporting data. Compared to table summaries, plotting shows you the whole picture and not just a descriptive statistic or two. This is great for detecting outliers and perceiving the dispersion of the data.
In this plot we are comparing the two experimental algorithms against the production algorithm for 100 queries. Each dot represents the Jaccard distance for a single query. Jaccard distance is calculated as (1 - Jaccard index), which makes it useful for plotting because higher values indicate more churn in the search results. So, we can see here that experiment 2 changes the results less than experiment 1, and it also has less variance across all of the queries:

Conclusions
Using the Jaccard Index shows Experiment 2 has less churn in the results which we can interpret as having less risk. This can be valuable information for queuing experiments and estimating live performance with users. However this doesn’t tell us anything about the quality of the results – we will always need relevance judgments for that. But the Jaccard index (and distance) gives us a simple and effective way to quantify the change in results without judgments, which makes it a valuable tool for your search toolkit.
If you need help developing techniques such as Jaccard Similarity to measure your search quality and help assess the risk of new algorithms, do get in touch.
image from Rock Vectors by Vecteezy