Category: Uncategorized
Most people find site search maddening to manage. How are your users searching? Is search helping or hurting the bottom line? It’s one thing to try a few pet peeve queries, and be annoyed at the results – but do these reflect how users actually search?
In this series of articles, I want to give you, the content person, a very practical and straight-forward guide to managing site search. We’ll start by discussing diagnosis – how to find problems. We’ll use a simple, free analytics tool (google analytics). We’ll make a few naive assumptions about these analytics that act as a good starting point.
These steps cover many of the steps in our relevancy consulting methodology. However, more closely targeted at content teams managing content in a CMS needing to satisfy a few thousand important search queries over thousands/tens of thousands of documents. We’ve assumed you’re able to setup google analytics for site search, but if you have any trouble follow Google’s straightforward instructions.
Exporting Search Keywords from Google Analytics
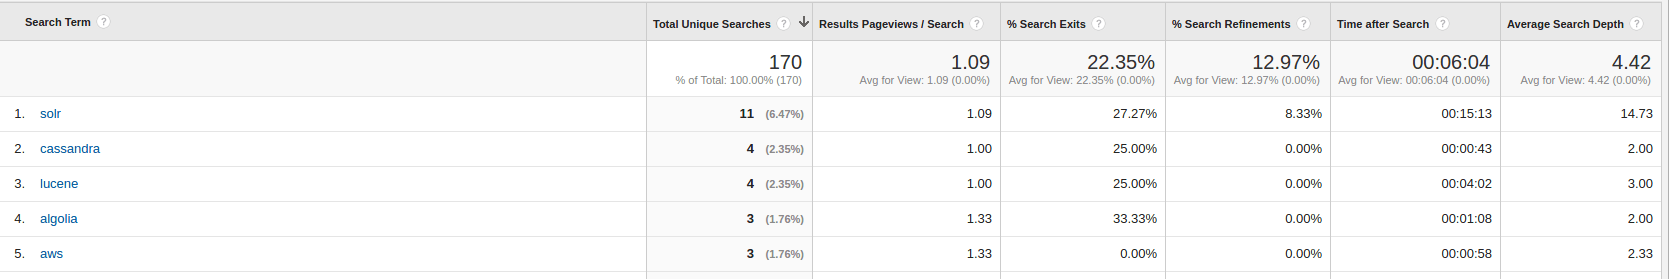
First let’s look at Google Analytics for site search. Here’s a small sample of OpenSource Connection’s site search analytics, showing top queries. We don’t get nearly the number of searches as our clients, but it’s a nice baby data set to play with.
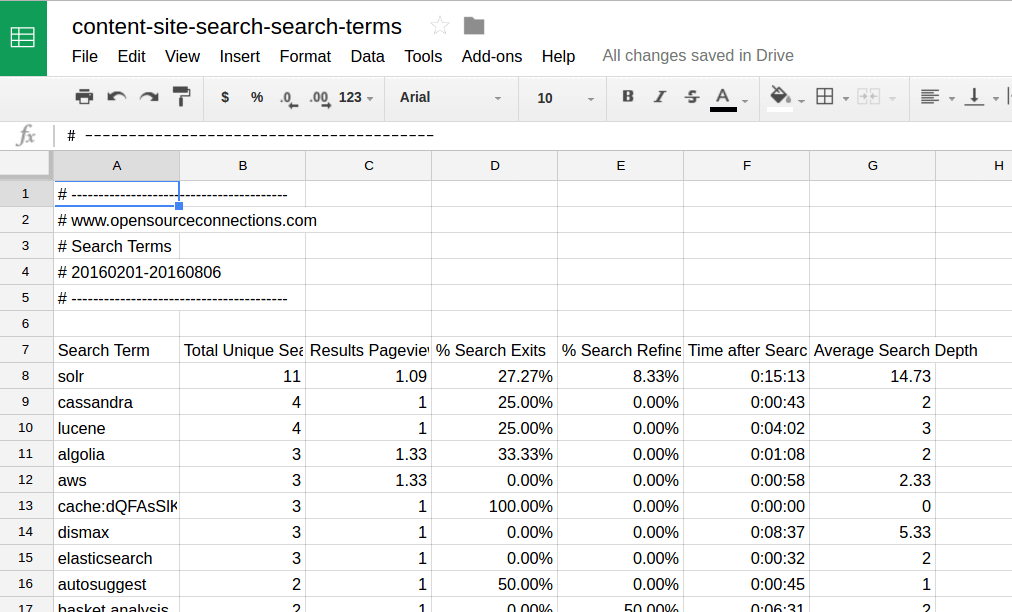
Second, we need to diagnose specific problems by playing with these search terms in a spreadsheet. Export google analytics search terms to excel or google sheets. Here we’ll use google sheets.
- Select “show rows” -> 5000 to get a meaningful sample of the most important queries
- Select “export to google sheets” up towards the top
This will give us a spreadsheet to work with with these stats. We’ll use the statistics here to find popular search queries with the most problems.
We’ll cover a high-level strategy for interpreting what’s here. If you’d like an in-depth rundown of how to interpret these statistics, I refer you to our blog article on google analytics for site search.
But a few things to point out. You’ll notice that “total unique searches” follows what us nerds call a logarithmic scale. That just means that the most popular query has many times more searches than the next most popular, and so on (Solr has 11 searches, Cassandra 4 etc). Eventually you get to a point where almost all the searches have occurred exactly once. This is what you’ll hear referred to as the “long tail” – the large number of search keywords that have occured rarely in the history of your application.
Compute a PER score
We’re going to create a column that combines several of the likely problematic statistics into a single statistic. The search keywords that score high for this statistic probably indicate a problem area for further investigation.
We’ll create a new column that performs the calculation combining several problematic statistics
log(total unique searches) * Results Page View * % search exits * % search refinementsTo review these stats briefly
- log(total unique searches) – This measures the importance of the search query. We could multiply “total unique searches” directly, but as the popular search occurs so much more than the next most popular, this would really blow away any other search. So we take the log to dampen down its impact a bit.
- Results page views – How many results pages did a user view (how often did they hit “next page”)? More pages means users could be struggling to find the item they want on the first page.
- Search exits – How often did users exit from the search page? If users exit straight from search, it could mean they’re frustrated by not being able to find anything.
- Search refinements – How often did users refine their search (instead of searching for solr, they added solr consulting to the search). This could indicate your search couldn’t satisfy their keywords and they had to try an alternate approach.
I like to call the combination of these stats a PER Score as in (pages * exits * refinements). This formula basically scores each keyword by popularity log(total unique searches) and higher page/exit/refinement statistics. The highest score would be a popular search term where users are paging, refining, and exiting a lot. However, it’s also useful in finding search keywords that are moderately popular that have big problems (lots of paging, exits, refinements). This points area that needs further investigation by your team as users seem to be frustrated.
We’ll adjust the formula slightly to account for cases where these values are 0. Final formula for the spreadsheet above becomes
=log(B9+1)*(C9 + 1)*(D9 + 1)*(E9 + 1)Interpreting a PER score
PER scores are an appropriate metric for roughly gauging search-as-navigation. Where users expect the top result to match what they’re looking for. They are searching for a single item (or small set of items) that match their keywords. For many content sites serving the general public, this is often the most common use case. It’s often the most important to get right.
However, it’s important to note this isn’t every search use case. Some users use search to research and compare different items, not just find the single best match for their search. For these users, PER score doesn’t make as much sense. Users like legal researchers, patent examiners, or advanced shoppers might view every result, hit next page frequently, and refine heavily so that no stone is unturned in their research. These statistics just point to a dogged researcher, not an annoyed searcher. Other analytics (outside the scope of this article) likely make sense for them. If you’re curious about the tradeoffs between these use cases, learn more about the concepts of precision and recall.
The takeaway is the PER score isn’t perfect. But a high PER score is what I’d call a “bad smell.” Something probably isn’t right with this search, and you should sniff out the reasons this query seems to be having so many pages, exits, or refinements. It’s possible you could isolate the reason to something not bad (users exit because you give them the answer on the search page) or related to a complex search use case.
Back to OSC’s site search, I’ve calculated the PER score and have sorted on that column to hunt for problem areas
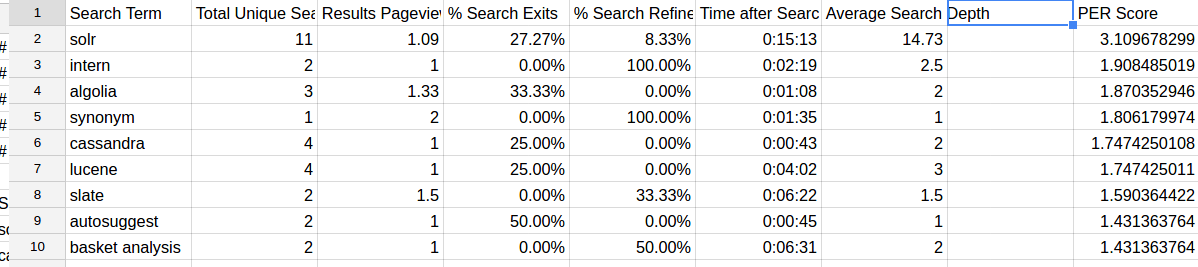
This points to some interesting patterns in our search. Even though these aren’t that statistically significant, my sense of our site and our company points to a few areas that could be improved:
- Most obviously: It’s very important that searches for various technologies (solr, lucene, cassandra, algolia) work well. They have a high “total unique searches” which drives up their PER score. I should do everything I can to understand those users and deliver what they want.
- The problematic search for “intern” surprised me. It’s marginally popular and seems to have issues: users always need to perform refinements. Knowing what I know about OSC, this is likely an OSC employee searching for blog posts written by interns. I’m pretty certain that we don’t have any way of search answering the question “this article is by an intern.” Perhaps we should work to address this use case?
- Someone searched for “slate” then refined what they were looking for (notice refinements of 100%). I know Eric Pugh wrote some articles about using Lowes data and a search engine to find some grout for his counter tops. Is this what they were after?
With most clients with many thousands of search users, we can usually find many surprising problems with search. This method goes beyond just highlighting what’s popular, but also fairly popular search queries somewhere that have big problems. Immediate resolution of these items can make a big difference in a business’s bottom line.
Takeaways
For relevance, you’re always iterating on your understanding of analytics. There’s no magic number that says “good search” that Google analytics (or any tool) can give you. You need to apply your own domain knowledge to decide what behaviors like paging, refinements, and exits mean for your application.
But the PER score is a good starting point for finding problem areas. You need to start somewhere to find issues. Don’t get too obsessed with perfect before moving to resolve the underlying technical/content issues for what you’re finding. We advocate for iterating fast and rebenchmarking search quickly. In future articles, we’ll discuss the importance of testing fixes and deploying relevance solutions quickly to production. We’ll also discuss the benefits of other statistics that tools like google analytics don’t track such as click depth (did the user select the 1st, 2nd, … or 10th search result?), click through rate, and conversions (did a user buy something?).
Hire The Experts
You can find solutions to your search that have great ROI. If you’d like us to evaluate how to measure your site search, feel free to get in touch and check out our relevancy services page.