
In April I went on a pilgrimage to Enterprise Data World to encourage my colleagues in the Data world who typically are focused on issues of Data Governance, Data Quality, and Data Standards, to think more about data from the perspective of the line of business end user who is actually trying to accomplish something with their precious data! To echo a line from the great keynote by Scott Berkun, data doesn’t actually do anything by itself, it’s what we do with the data that matters!
I’m going to recap a couple of sessions below, and then share my key take aways. There were were so many sessions, it was almost too hard to pick what to focus on!
Recap of sessions
I started out sitting in on a great talk by Cathy Normand from ExxonMobile on how to enable metadata strategies. Interestingly she articulated a strong you need to market to your users philosophy. Too often in the IT world we take the “build it and they will come” philosophy, something I am seeing with a current customer project ;-). She talked about using gamification and going out to meet the end users in their natural habitat and evangelizing the need to provide good quality metadata as key:
It’s a lot of work, but it’s also always changing, and that’s interesting!
I also attended a session on the FIBO group about Knowledge Graph and AI, who had their own sub track at the conference. FIBO stands for Financial Industry Business Ontology. I had an interesting conversation with a fellow attendee about it, and it in some ways represented the best and worst of Semantic thinking. FIBO is very powerful in modeling relationships, but only as long as the relationships being modeled actually reflect the real world! And the real world, especially in some of the less traditional finance industries, seem to be much messier then these structured semantic worlds. It reaffirmed my thinking that semantic structures, and the query languages like SPARQL are great for a very narrow well-defined domain, but the reality is most of us work in much broader multi domain worlds, where highly structured relationships like FIBO break down.
I then got to sit in on a talk that finally introduced semantic blockchain… I knew someone would bring up that buzzword ;-).
I dropped in on a talk that purpoted to demonstrate how easy it is to build a UI using transformation languages like XQuery. Having burned my fingers on building a complete robust website using XQL, I listened to see if the speaker changed my mind, but he didn’t. XML transformation languages are not good choices for building robust applications (hint hint Marklogic, TopQuadrant, etc).
There was another interesting talk about doing entity extraction on forms, and how they did specific analyzers to look for “wet ink” style signatures etc. Laid out some nice pros and cons of building it outside of your data platform. It was also cool to see the shout out for Tesseract OCR.
I really enjoyed Scott Berkun’s keynote talk on creativity and ideas.
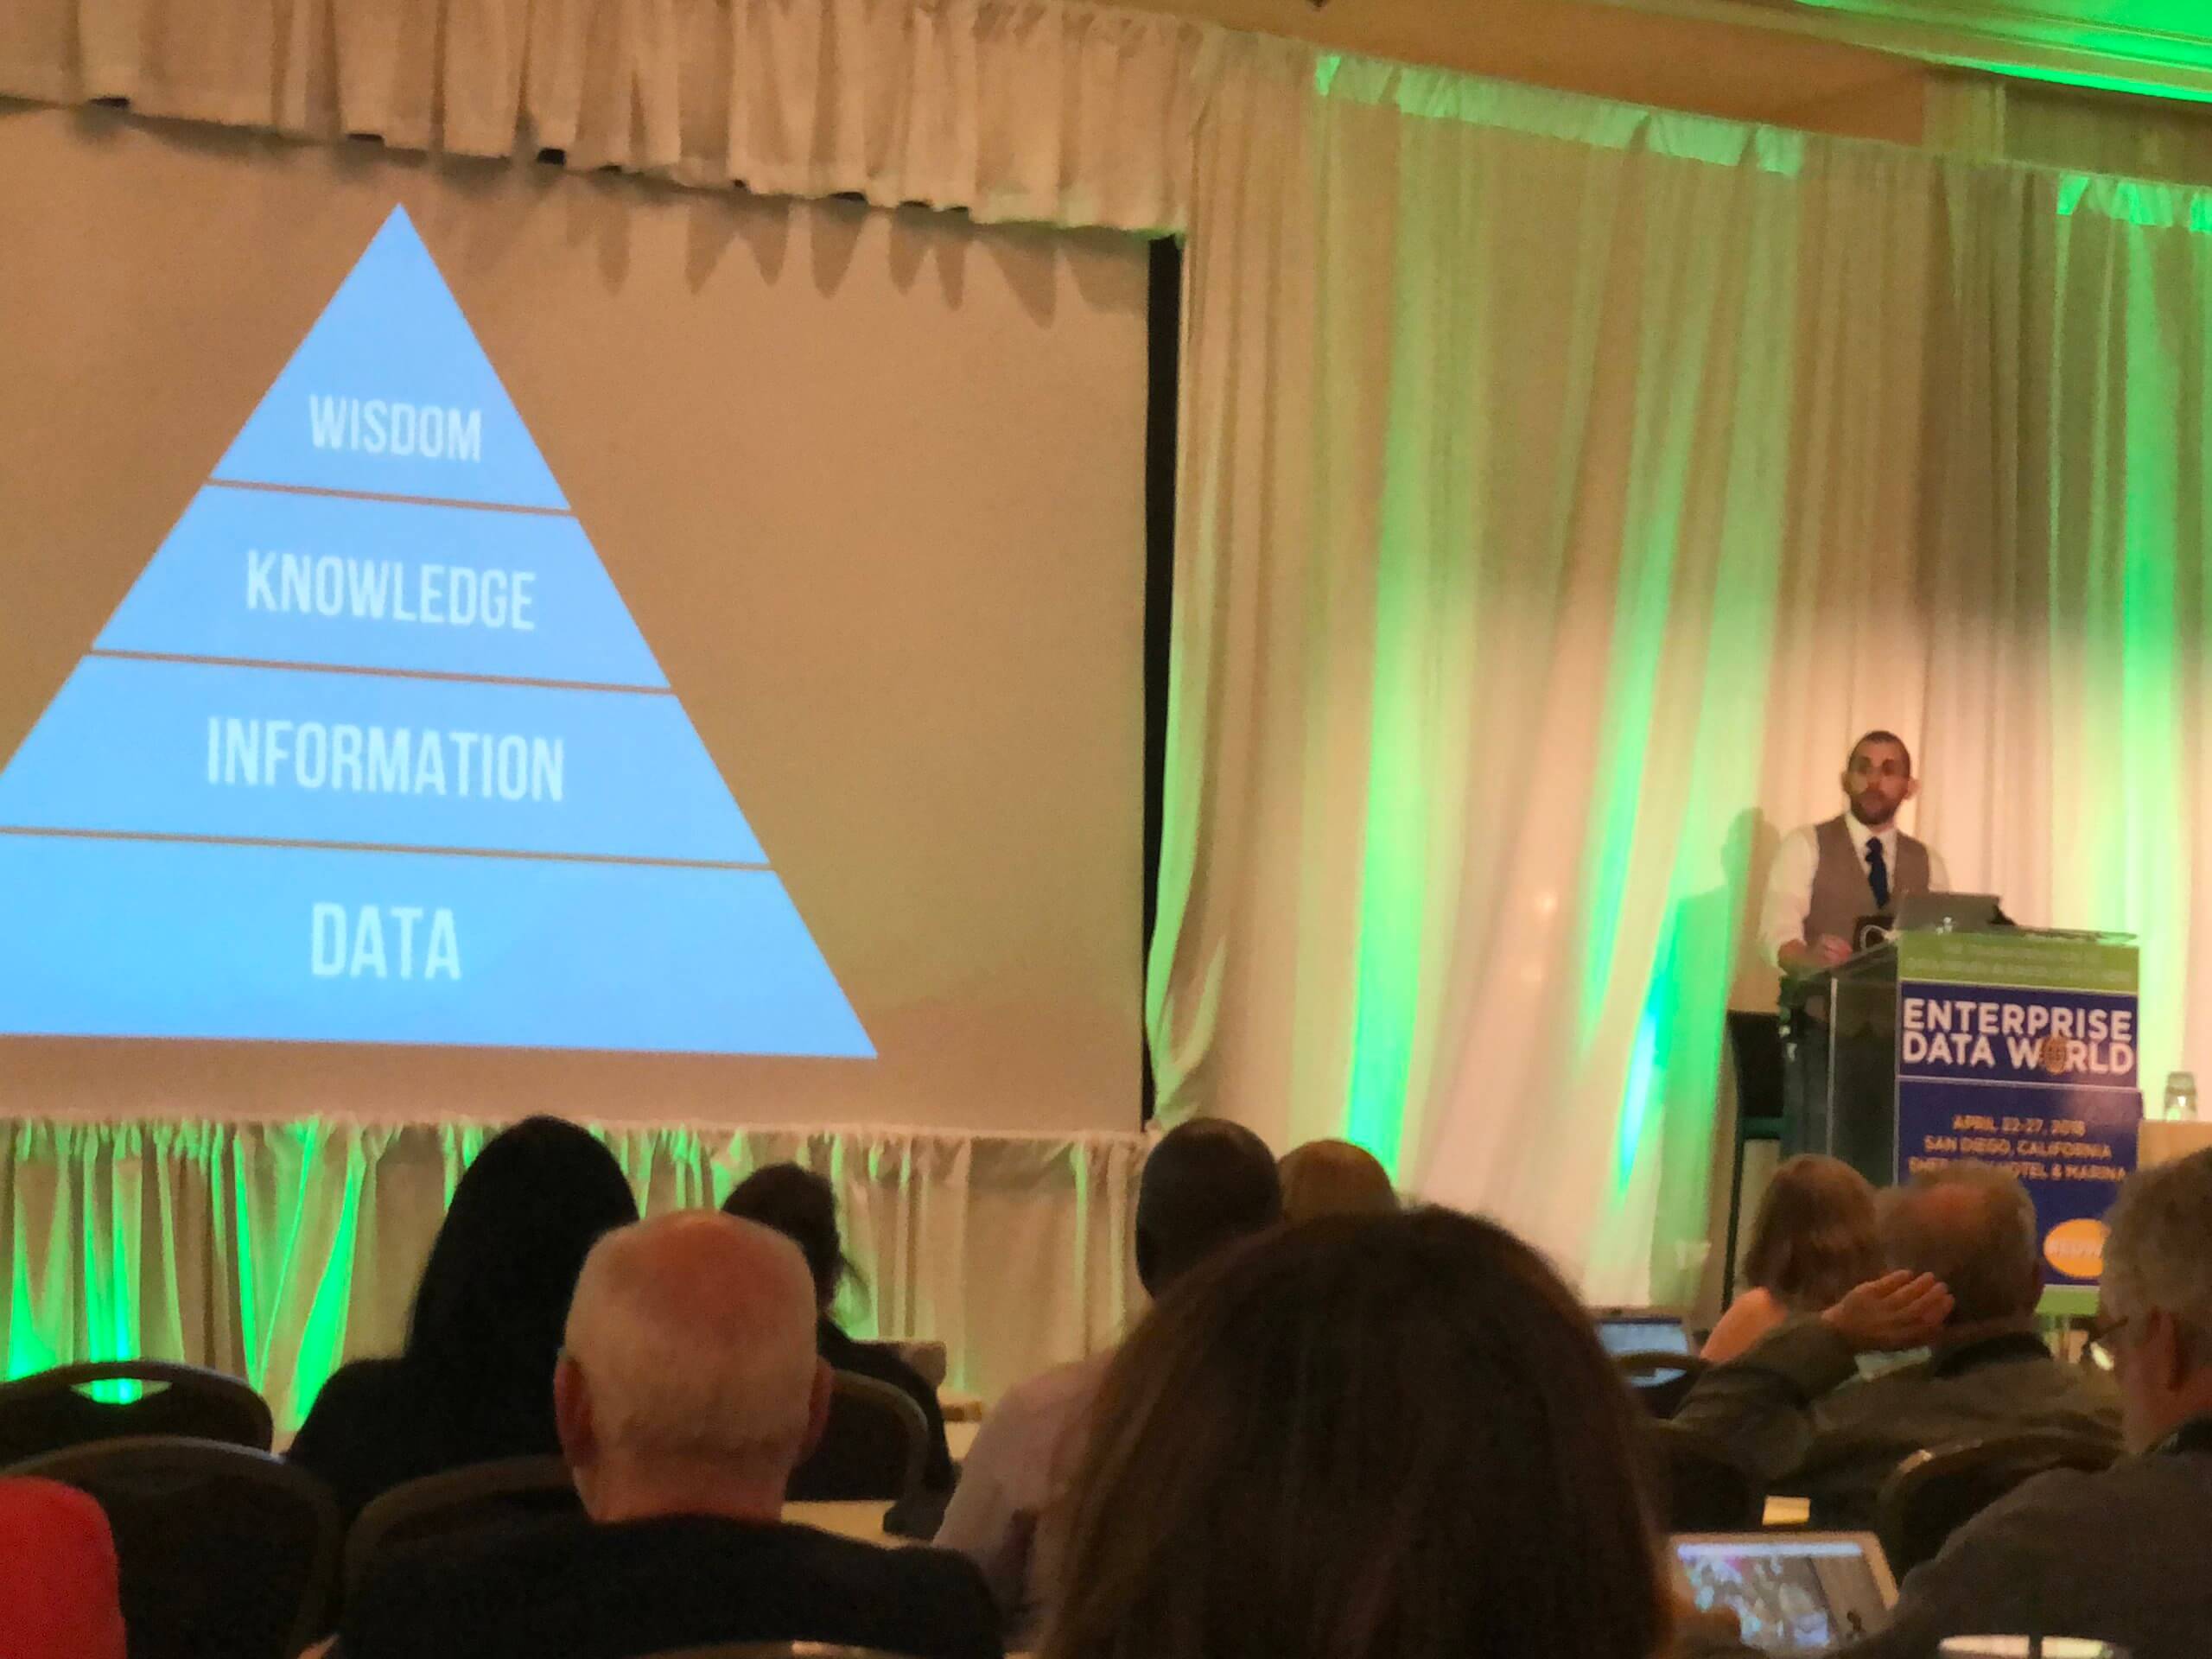
I like pyramids, so does Scott Berkun
His keynote felt more topical than most that I’ve seen, and I thought he posited some very interesting ideas, specifically that he feels the phrase the data says should be verboten! I like that he pushed the message that the data is always interpreted by people. When we set up a relevance project, we typically are pushing to identify some pretty specific hard KPI’s to measure the impact of the work we are doing. For example “Revenue per Search” or “Requests for Data Set per Search”, as well as the oldie by goodie “NDCG” metric. I wonder if KPI’s that are generated by data are a case of falling in the the data says trap….?
My Takeaways
-
One of OSC’s tag lines was Data –> Information –> Wisdom, which mapped nicely on to a pyramid of creativity that Scott mentioned.
-
We’ve seen that as you move up the pyramic, you need more and cleaner data sets to get closer to that, dare I say it, Cognitive AI search platform. I don’t think we’ll ever really go deep in Data Governance, beyond recognizing that it’s a good thing to encourage good data sets 😉
-
In learning more about data quality, I’m seeing some tools and ideas to help us better understand the shape of the data, and incorporate the quality of the data as a signal into our relevancy algorithms. I can see us having boost factors based on quality of data set in making matches. Or deciding what datasets to use or not based on a analysis of data quality.
-
Enterprise Data World since my last visit in 2014 has become more relevant to search folks, and I’m not sure if the topics have changed over time, or if our focus on data and machine learning has led us closer to the conference’s core topics!
Lastly, I also want to point to a Twitter thread that @HealthcareWen shared. She captured some great nuggets of information from a number of sessions that I didn’t get to attend.
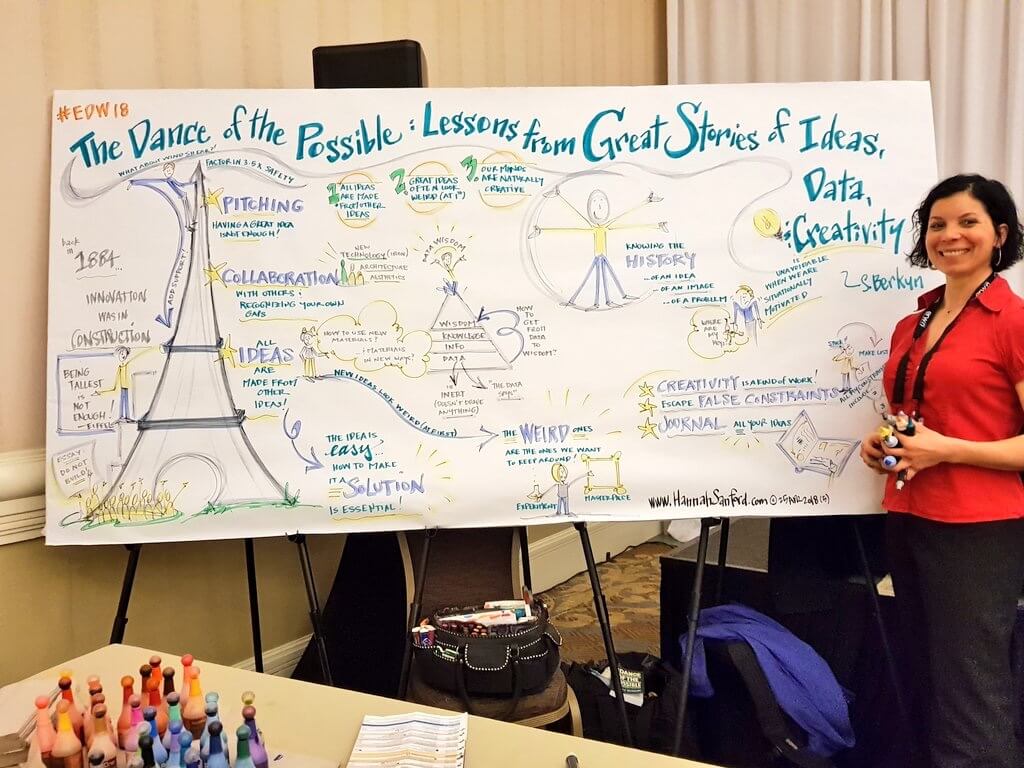
Comics! She spent the week drawing amazing comics as speakers talked!
One More Thing
I’m working with a client who has ~60 data sources in various systems, and we’re working with them to start answering questions that they never could previously by bringing together data sets that had never been joined before. They have a very intuitive sense of “what the right decisions are”, but correctly, are looking to check those intuitions against actual data to help them refine their decision making. Plus, find new startling insights by finding less obvious patterns in the data. A key challenge is that there is no “roadmap” to the datasets. They are doing some good governance things like establishing a data steward for each data set, but there are no cross data set links. To figure out how two data sets would work together. I have a mental picture of a traditional highway map, where the think Interstate lines map the very strong connections between data sets, ie. good primary keys, clean data sets, complete records on either side. And then lesser lines to represent highways, byways, and then local roads reflecting the less probably connections between the data sets.
I’m thinking this is a graph of knowledge, but how to get that knowledge? I’ve been involved in too many projects that said “data lake”, or “data warehouse” and spent all the budget moving the data around, and not enough on understanding it. So how to flip that paradigm? One of the topics was the idea of Data Virtualization, a new term to me. here the idea is that instead of directly accessing the data, I work with a virtual data set. That virtual layer abstracts me form the underlying format, and lets me keep my 60+ data sets in their original platform, whether that is a RDBMS, a CSV flat file, a big data solution, or even a API or website… It lets me start playing with the data using a common language like SQL. Denodo is the vendor at EDW who was talking about this approach, and from a “lets get started” perspective, there was a lot I liked. Yes, it has limitations, including I am querying potentially production systems… I’m intrigued to see if I can put on my Data Cartographer hat and start building that roadmap to the data for other business oriented folks to leverage to ask questions they didn’t think they could before!